Environmental and Social Data

Non-financial Highlights

Stacked bar chart showing greenhouse gas emissions (Scope 1 and Scope 2) from FY2021/3 to FY2025/3. Non-consolidated emissions decrease from 1,900 t-CO₂e in 2021 to 808 in 2023, while consolidated emissions rise to 4,699 in 2024 and 4,532 in 2025. Scope 1 and Scope 2 values are indicated separately.
Bar chart showing amount of waste and resource recycling ratio from FY2021/3 to FY2025/3. Total waste decreases from 1,558 tons in 2021 to 741 tons in 2025, while recycling ratio remains stable around 91–92%.
Stacked bar chart showing contribution to reducing CO₂ emissions from FY2021/3 to FY2025/3. Values increase from 9.5 (10,000 t-CO₂) in 2021 to 119.1 in 2025, with contributions split between renewable energy power generation and general leasing.
Bar chart showing number of employees (consolidated) from FY2021/3 to FY2025/3. Employee count rises from 3,631 in 2021 to 4,859 in 2025.
Combination chart showing average number of paid leave days taken and percentage taken from FY2021/3 to FY2025/3. Average days increase slightly from 16.2 in 2021 to 18.1 in 2025, while percentage rises from 84.4% to 92.3%.
Combination chart showing number and percentage of female managers from FY2021/3 to FY2025/3. Female managers increase from 38 in 2021 to 108 in 2025, while percentage rises from 5.8% to 14.1%.
Stacked bar chart showing number of childcare leave system users by gender and utilization rate from FY2021/3 to FY2025/3. Female utilization remains at 100%, male utilization rises from 21 users in 2021 to 51 in 2025.
Line chart showing percentage of employees with disabilities hired from FY2021/3 to FY2025/3. Rate increases from 2.30% in 2021 to 2.77% in 2024, then slightly decreases to 2.66% in 2025.
Table showing consolidated GHG emissions for FY2023 and FY2024 by scope and category. Scope 1 totals: 2,665 (2023) and 3,223 (2024). Scope 2 market-based: 2,034 and 1,309. Scope 3 includes major categories such as purchased products (41,252 and 46,728) and capital goods (over 5 million t-CO₂).
  • *1 In principle, we use the emission factors published in the Greenhouse Gas Emissions Accounting, Reporting and Disclosure System under Japan’s Act on Promotion of Global Warming Countermeasures to calculate Scope 1 emissions.
  • *2 In principle, we use the provider-specific emission factors; otherwise, we use the country-specific emission factors published by IEA to calculate Scope 2 emissions.
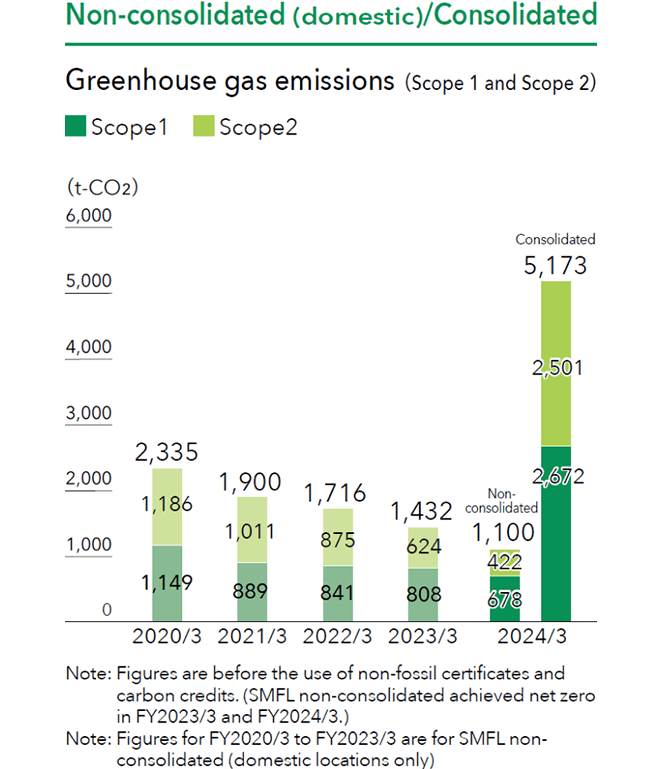
  • *3 Due to the review of the calculation boundary, Scope 2 emissions for FY2023 were revised.
  • *4 SMFL Group has obtained third-party assurance for its Scope 1 and 2 emissions for FY2024.
  • *5 Emissions that were recorded as category 12 from FY2023 have been reclassified as category 5 in line with the revision to methodology.
  • *6 Data is compiled from companies for which data is available.
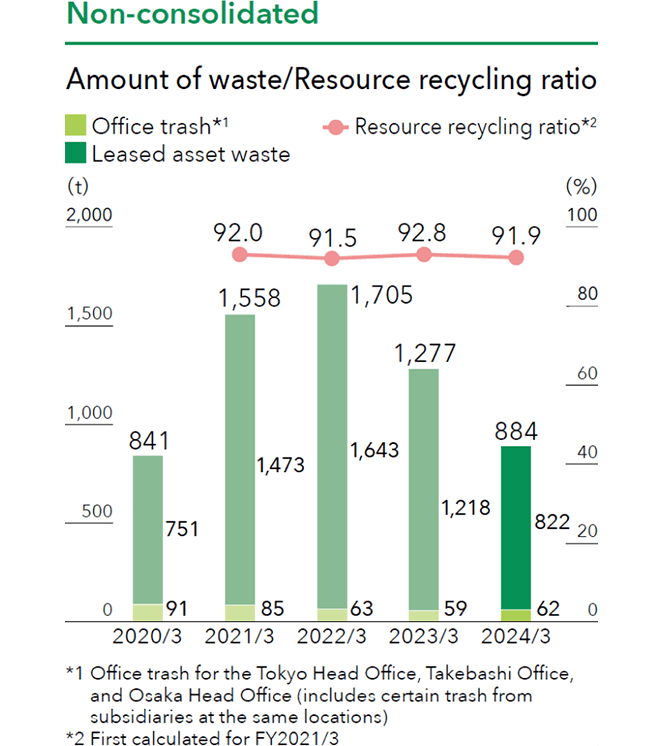
  • *7 FY2023 data is calculated for SMFL and domestic affiliates occupying the following offices (Tokyo Head Office, Osaka Head Office, Takebashi Office).
  • *8 FY2023 data is calculated for SMFL and SMFL MIRAI Partners Co., Ltd.
  • *9 Scope 3 Category 13 is calculated based on aircrafts owned by SMBC AC and other transportation equipment under leases contracts with SMFL and may increase in the future as assets subject to calculation expand.
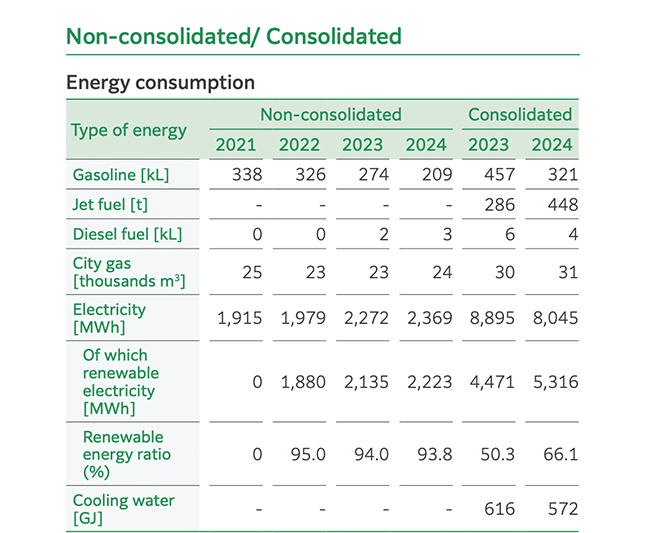
Table showing energy consumption for non-consolidated (2021–2024) and consolidated (2023–2024) data. Includes gasoline, jet fuel, diesel, city gas, electricity, renewable electricity, renewable energy ratio, and cooling water. Electricity consumption rises to 2,369 MWh non-consolidated and 8,045 MWh consolidated in 2024.
  • Renewable electricity includes the amount of non-fossil fuel certificates purchased